Written by
Daniel Marvin
on
on
Finding a Trendline with Least Squares
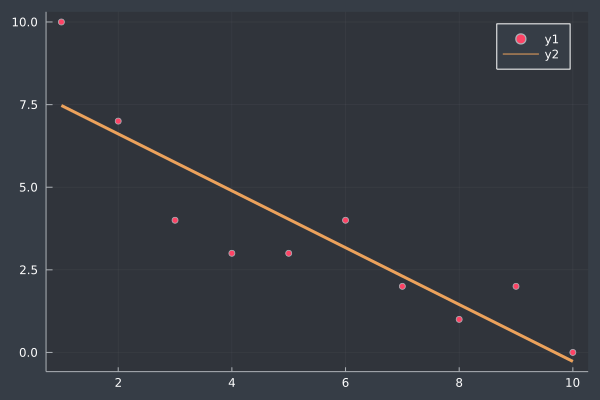
When we look at a bunch of points, it can sometimes be challenging to see how the data is moving and it is very helpful to be able to identify a trendline.
Suppose we have a bunch of data points in \(y\). We create a matrix, \(X\) which consists of the pattern that we want to match. The first column will be all \(1\)s because that’s the constant term. The second column will be the numbers \(1\) through \(N\) for the linear term.
\[X = \begin{bmatrix}1 & 1 \\ 1 & 2 \\ 1 & 3 \\ \vdots & \vdots \\ 1 & N \end{bmatrix}\]We need to solve the equation,
\[X \mathbf{b} = \mathbf{y} \ .\] \[\begin{aligned} X^\top X \mathbf{b} &= X^\top \mathbf{y} \\ (X^\top X)^{-1} (X^\top X) \mathbf{b} &= (X^\top X)^{-1} X^\top \mathbf{y} \\ \mathbb{1}\cdot\mathbf{b} &= (X^\top X)^{-1} X^\top \mathbf{y} \\ \mathbf{b} &= (X^\top X)^{-1} X^\top \mathbf{y} \\ \end{aligned}\]Just like in Matlab, the single quote is an operator we can use to reference the transpose of a matrix.
using Plots

y = [10.0, 7.0, 4.0, 3.0, 3.0, 4.0, 2.0, 1.0, 2.0, 0.0]
X = [ ones(10) 1:10 ]

b = inv(X' * X) * X' * y

scatter(y)
plot!(X * b, lw=3)